
The three biggest limiting factors for your email marketing are:
All of this can be avoided by using simple testing: either by adapting as you go along, or better still by running in-email A/B optimisation.
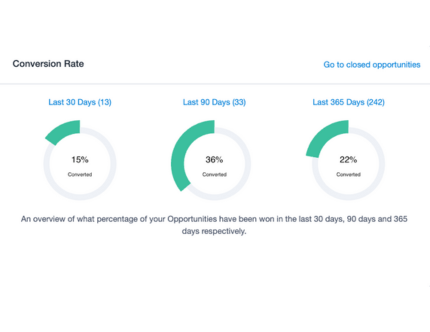
What this means is that you can send a proportion of a list one email (normally half) and then the rest of the list a variation on that email and then compare the performance: open rate, click throughs, orders and any other metric you’d like to value.
Then, based on previous performance, you develop your next email to perform at least as well as the best of your two test emailshots with further optimisation and testing.
So, let’s do our own A, B, C test…
They send an emailshot to a house list 12 times a year, and perhaps review their look and feel every 1-2 years.
For every send, they will experience attrition in performance of around 2% (a conservative estimate) a recipients get more familar, and bored, with their emails. At the end of the year their performance will be: 100 * (0.98)12 = 78%

Let’s say you employ a monkey to test for you. They have no marketing knowledge to understand whether changes made will work better or worse than your current newsletter. All they can do is make small changes to the email, perform A/B testing and optimise the next email based on what the stats tell them.
On average their difference in performance is 4%, so the first newsletter performance is likely to be no different than without testing. But, on the second newsletter, they are able to carry forward the better performing one. So their NET performance improvement is 2% as they take forward the learning to your newsletter. At the end of the year, their performance will be: 100 * (1.02)11 = 124%
If you took this issue seriously and decided to use an email optimisation specialist. Every time they developed an email and testing campaign for you, they would test subject lines, images, layout, background, button colours, copy and messages.
Most of the time, their recommendations and improvements would exceed 10% performance improvement, although occasionally it may flatline or even decrease slightly, it would be reasonable to suggest that they could sustain about a 4% upwards trend month on month for the first year. At the end of year one, the performance would be: 100 * (1.04)12 = 160%
So, what can we learn from this simple illustration? Here are our top tips:
Optimising emails isn’t hard, even a monkey could do it, and you should too!

Together with Unloq, we explored different content strategies that would increase their AI search rankings. We decided to implement a series of white papers to the site, which are commonplace in the mergers and acquisitions industry.
Each white paper included various citations from verified sources, and the content was impartial and balanced. This is extremely beneficial for AISEO, as LLMs cite sources which they deem as well-informed and unbiased.
AI LLMs cite sources which they deem as balanced and well-informed. So, we decided to add a series of comprehensive technical documents to the Vistafolia site, including one evaluating ‘Living vs. Artificial Green Walls’.
The document serves multiple purposes. It is live on the site menu to be viewed, should people be interested in reading it, and optimised for SEO, but it is also cited by LLMs (including ChatGPT) when someone asks a related question – for example “evaluate living vs. artificial green walls”.


The ability to persuade visitors and generate leads in a field as challenging as mergers and acquisitions needed a very careful and considered approach. Attention to detail and the use of the right language are crucial to gaining the trust and confidence of the audience.
We worked closely with Unloq, so that we could learn more about the world of M&A, as well as their specific needs. We delivered two websites, both with specific goals, as well as a host of automation features – including a real-time connection between their CRM and WordPress to update the content.
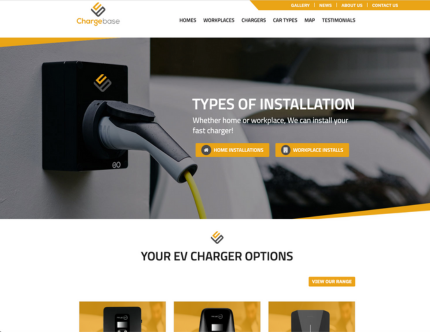
It’s always exciting working on a new venture. Chargebase has developed a direct-to-market proposition for car chargers, as well as a turnkey approach to home electrical work.
From developing their branding, building two distinct websites with two different online lead generation strategies, we have worked with the management team to launch a one of the South East’s leading EV specialists.

Writing up a proposal is often an overly time-consuming process, and when you are trying to secure a sale, time is of the essence. Our client knew this, so we worked with them to build an automated proposal system in Airtable.
All of the bespoke information and data is added into easy-to-fill Airtable cells. Then, when a customer proposal is required, all that’s left to do is simply select the relevant fields, and a proposal is created in minutes – enhancing conversion rates and simultaneously saving employee time.
As a mergers and acquisitions firm, the mandates are a very important section of Unloq’s website. Each one contains a significant amount of data, and copying this across manually would both waste time and significantly increase the risk of error.
We helped them to develop an automation that sees mandate data pulled from Airtable directly into WordPress at the click of a button. This greatly increases their efficiency and accuracy in the onboarding process of a new client.


When we took on the websites for HCL, we wanted to help them in two ways. Firstly, we wanted to replace the platform they were using which, though Open Source, was buggy and limited and meant that most of their budget was spent on fixing issues rather than improving.
Secondly, we wanted to grow their business by connecting fully the marketing spend with the yield. We also persuaded them to focus on lifetime value as much as the first order and put strategies in place for repeat business and customer segmentation.
Three years later, they’d sold over four times as much, and were making significantly better margins.

Toynbee had just recruited a manager and was looking to bring together all their enquiries and proposals into one place. We recommended, configured and launched a CRM for them that gave them visibility over all their leads, adapting as they developed and grew.
They run a variety of complex projects, all requiring clear tracking and client updates. We also worked with them to design and implement a no-code platform that manages projects clearly from order to fulfilment, ensuring deadlines are met.
With a growing sales team, and a range of clients and business partners with differing demands, we needed to not only store records, but also to drive the business forward.
We set up the various Opportunities, Tasks, Tracks and Tags to match the way in which the business went about the value chain and to segment their prospects and customers. We imported all the data from their previous CRM to track and store everything. We helped with adoption, and now no lead or opportunity goes to waste.

Our client was a merger of a much smaller business and an established portfolio of commercial spaces. It needed a modern brand which combined some of the palettes of the established businesses, but also developed something fresh for future marketing.
The combination of blue, yellow and white is strong and yet flexible, offering a distinctive and confident brand, whether on a billboard or website.
Taking on an unexpected full rebrand in thirty days was not necessarily part of the remit, but we’re always up for a challenge.
New iconography in place with a subtle and yet distinct nod to hydraulics and the ‘D’ for Domin. We also founded and formed a proper brand book to ensure that consistency remains in place for cross-media activity.

When it comes to mergers and acquisitions, clarity of message and presentation is paramount. We worked closely with the client, writing a script, choosing a voice-over artist, stitching together images, video and illustrations.
The two videos were short enough to share on social media, but professional enough to take pride of place on the website – raising the profile and credibility of Unloq and with more to come.
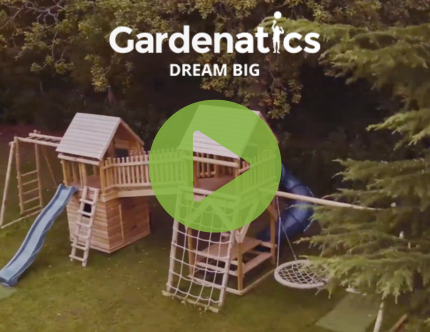
How best to display some of the finest tree houses and climbing frame builds in the UK? We used a combination of close-up and drone footage to showcase Gardenatics’ custom builds.
It makes the website stand out, differentiating from the competition and justifying the quality and value on display. It has helped them continue to win new clients across England and Wales looking for that premium option.

Vistafolia sell artificial green walls, but their website isn’t e-commerce. They sell through conversations, and in order to have these conversations their ads need to be fine-tuned to target the correct demographics.
We have worked with them to increase the quality of their enquiries, moving from a significant number of low-intent brochure requests to higher-intent detailed enquiries, meeting bookings and calls.
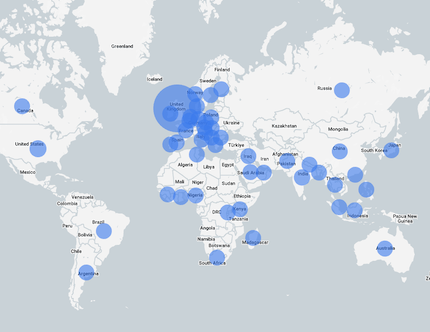
Three different websites, covering all continents and over sixty countries. Two are e-commerce, one is lead-generation and all need to be tracked, measured and accounted for.
It’s hardly a simple task, but one we are up to. Having helped quadruple their online sales in the UK, we are now ramping up North America and the rest of the world.

The ability to persuade visitors and generate leads in a field as challenging as mergers and acquisitions needed a very careful and considered approach. Attention to detail and the use of the right language are crucial to gaining the trust and confidence of the audience.
We worked closely with Unloq, so that we could learn more about the world of M&A, as well as their specific needs. We delivered two websites, both with specific goals, as well as a host of automation features – including a real-time connection between their CRM and WordPress to update the content.
It’s always exciting working on a new venture. Chargebase has developed a direct-to-market proposition for car chargers, as well as a turnkey approach to home electrical work.
From developing their branding, building two distinct websites with two different online lead generation strategies, we have worked with the management team to launch a one of the South East’s leading EV specialists.

Having worked with Nautilus Sailing for over ten years, through three websites where we developed and optimised a highly effective lead generation system, we have helped them grow from two locations to eight. From two instructors to a team of ten.
They focus on running the finest skipper school on the planet, we get them the customers who want the best experience.
It should be simple to find leads for EV charging in the South East of England, but sometimes what looks easy is, in fact, a real technical challenge.
Firstly, whilst there is a lot of searching for EV points, we only want to target those who want an installation. Secondly, we also need to avoid congested areas where there is only on-street parking. Finally, they had a preference for commercial, not residential installations.
Not so simple, but we plugged away and found a steady flow of electric leads.
Writing up a proposal is often an overly time-consuming process, and when you are trying to secure a sale, time is of the essence. Our client knew this, so we worked with them to build an automated proposal system in Airtable.
All of the bespoke information and data is added into easy-to-fill Airtable cells. Then, when a customer proposal is required, all that’s left to do is simply select the relevant fields, and a proposal is created in minutes – enhancing conversion rates and simultaneously saving employee time.
As a mergers and acquisitions firm, the mandates are a very important section of Unloq’s website. Each one contains a significant amount of data, and copying this across manually would both waste time and significantly increase the risk of error.
We helped them to develop an automation that sees mandate data pulled from Airtable directly into WordPress at the click of a button. This greatly increases their efficiency and accuracy in the onboarding process of a new client.

The artificial green wall market has become increasingly saturated in recent times, meaning generating organic traffic is more important than ever.
We built a list of target keywords, and optimised Vistafolia’s site for SEO, in order to help them rank on organic search. This optimisation also covers the inclusion of comprehensive technical documents, which have SEO and AISEO benefits.
Vistafolia sell artificial green walls, but their website isn’t e-commerce. They sell through conversations, and in order to have these conversations their ads need to be fine-tuned to target the correct demographics.
We have worked with them to increase the quality of their enquiries, moving from a significant number of low-intent brochure requests to higher-intent detailed enquiries, meeting bookings and calls.
What is there not to love about kids and garden play? The photos are great, settings wonderful and the structures are pretty awesome. But, to be honest, you can’t have photos of children included and then all the structures are based around the same ‘ingredients’.
So, you need to become storytellers, as tree houses and adventure play is about the joy and fun to be had by small and large adventurers as their ideas spark into life. It’s the story we tell!
When you have a range of products that is not very ‘instagrammable’ then it’s easy to lose sight of why they matter and how to promote them effectively. Though these products are small and seemingly uninspiring, they are vitally important to the users.
They stop leaks and breakdowns, electrocution and pier collapse. They help machines function, and cars motor. In short, there is a lot to say, if you have imagination.
The artificial green wall market has become increasingly saturated in recent times, meaning generating organic traffic is more important than ever.
We built a list of target keywords, and optimised Vistafolia’s site for SEO, in order to help them rank on organic search. This optimisation also covers the inclusion of comprehensive technical documents, which have SEO and AISEO benefits.
Each visit to Nautilus’ website is valuable, due to the specialised nature of their field. Instead of prioritising quantity, we put more emphasis on generating high-quality inquiries.
Through our analysis, we identified specific keywords that were highly effective in generating leads for Nautilus. To capitalise on this, we created two separate websites catering to different audiences, tailoring them to different sets of keyword clusters.

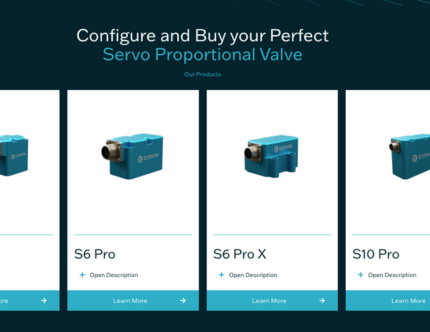
If you’re challenging an established industry where cost, supply chain and value is a mystery, then what better way to differentiate than do the opposite.
We created transparent pricing, clear discounts, delivery expectations and global dispatch. Each product had about a thousand combinations, so clients could order exactly what they wanted.
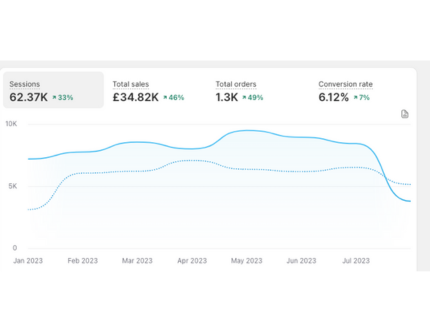
Scaled a leading ASA sailing school’s revenue from $100k to $1.5m by delivering a full-funnel digital strategy – including a complex WordPress build, rebranding, and CRM optimisation – that achieved 4x organic and 10x paid traffic growth while maintaining conversion rates.

With a growing reputation, but skippering being seen as a one-hit sale, it seemed that repeat business would be a challenge. However, Nautilus had two strategies we were able to support with very effective marketing campaigns.
Firstly, they now have an Alumni network called ‘The Tribe’ who regularly go on flotillas with each other, coordinated by Nautilus. Secondly, they have catamaran deliveries where different teams are assembled to take their boats point to point, often across oceans – another level of experience!
HCL had a burgeoning database of current and past clients but relied on their memory, loyalty and the occasional call to increase repeat business. This meant that they were overspending on new customers and not looking after the ones they had won.
We engaged with them and helped them segment their database, identifying which clients were interested in which products, how they preferred to order and to come up with a meaningful, frequent contact strategy. Business is booming.
Our client was a merger of a much smaller business and an established portfolio of commercial spaces. It needed a modern brand which combined some of the palettes of the established businesses, but also developed something fresh for future marketing.
The combination of blue, yellow and white is strong and yet flexible, offering a distinctive and confident brand, whether on a billboard or website.
Taking on an unexpected full rebrand in thirty days was not necessarily part of the remit, but we’re always up for a challenge.
New iconography in place with a subtle and yet distinct nod to hydraulics and the ‘D’ for Domin. We also founded and formed a proper brand book to ensure that consistency remains in place for cross-media activity.
The ability to persuade visitors and generate leads in a field as challenging as mergers and acquisitions needed a very careful and considered approach. Attention to detail and the use of the right language are crucial to gaining the trust and confidence of the audience.
We worked closely with Unloq, so that we could learn more about the world of M&A, as well as their specific needs. We delivered two websites, both with specific goals, as well as a host of automation features – including a real-time connection between their CRM and WordPress to update the content.
If you’re challenging an established industry where cost, supply chain and value is a mystery, then what better way to differentiate than do the opposite.
We created transparent pricing, clear discounts, delivery expectations and global dispatch. Each product had about a thousand combinations, so clients could order exactly what they wanted.
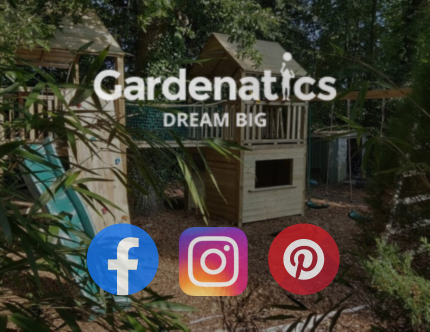
Tree houses and climbing frames are really easy to share, every family loves some active play. However, for Gardenatics we needed to make sure that we selected the right strategies for the right platforms.
In particular, the Pinterest channel we created for them gave great scope and leverage for the brand, as photos of builds were pinned far and wide and, given the bespoke nature of the constructions – future customers knew the best brand to help them with their garden was, of course, our client.
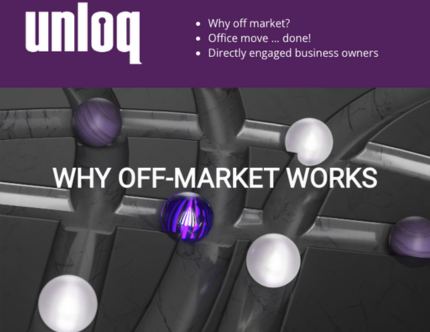
Unloq’s aim is to stand out and be different in the M&A world, but at the same time, to give confidence in the services they offer. They have to both be confident and discreet, persuasive but measured.
Our social media strategy is to ensure that we use a combination of videos, stings, dynamic messages and text to continue to reinforce the values and services which make our client the best route to inorganic business growth.

When we initially worked with Nautilus, they had grown successfully on an inbox and a spreadsheet. For a small business, that makes sense and keeps it simple, but it becomes harder the more conversations, quotes and bookings are managed.
It became clear that they needed to collaborate and track more.
With an envious Tripadvisor rating, their customers expect the perfect experience. Having scoped out their requirements, we helped them choose the right CRM and then helped scope it out to fit their needs perfectly. Now their office team of four can work together, using a range of communication channels to get the job done.
Two websites offering a wide range of services, where quality leads are of high value, but there are large volumes of time-wasters, it is vital to ensure that every lead is accounted for.
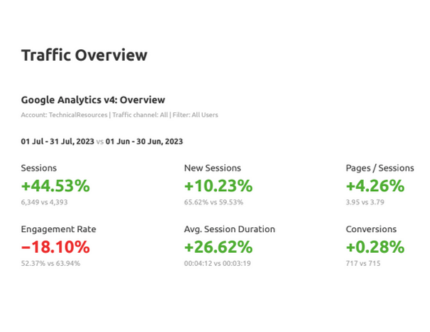
Our ‘secret source’ for them tracks from Ads, Organic, Google Analytics 4 and in their CRM to make sure that we know exactly the cost of every good opportunity. In that way, we can flex accordingly.
With five different types of lead, and several marketing channels, and a brand new website, we needed to work really carefully to knit together the best tracking solution to account for the cost of inbound.
Then, working with the client, we can also place a value on each type of lead, to ensure that we continue to drive value to both our client, their recruiters and future candidates.

Structural engineering is a challenging sector to visually attract as well as get a message across. The process is dry, technical … and when being installed is just plain muddy.
However, the end result showcases the hard work that has gone before. Beautiful outcomes are the result of painstaking planning and meticulous production. We use imagery of the future to create that desire today.
The most valuable aspect of Domin’s products is hidden in the ‘secret sauce’ of how they build the most efficient and compact hydraulic systems. The products are well-engineered but, frankly, are difficult to get excited about.
By focusing on the benefits and outcomes, we helped Domin create a much stronger set of messages: highlighting precisely the most compelling reasons to make the change: environment, efficiency and overall performance.

Writing up a proposal is often an overly time-consuming process, and when you are trying to secure a sale, time is of the essence. Our client knew this, so we worked with them to build an automated proposal system in Airtable.
All of the bespoke information and data is added into easy-to-fill Airtable cells. Then, when a customer proposal is required, all that’s left to do is simply select the relevant fields, and a proposal is created in minutes – enhancing conversion rates and simultaneously saving employee time.
As a mergers and acquisitions firm, the mandates are a very important section of Unloq’s website. Each one contains a significant amount of data, and copying this across manually would both waste time and significantly increase the risk of error.
We helped them to develop an automation that sees mandate data pulled from Airtable directly into WordPress at the click of a button. This greatly increases their efficiency and accuracy in the onboarding process of a new client.
High-value, low-volume email marketing requires a specialised approach. One that speaks the right language to partners, clients and prospects, whilst underpinning the values that make Unloq’s services unique.
With split lists, containing some shared and some unique content, we have created variety without the overhead of coming up with three completely new emails every time. Precise, targeted and confident – just like our client.
With a wide range of products, applications and service offerings, HCL could be seen as demanding. Yet, by integrating segmentation techniques on company size, sector and purchase history, we are able to choose the audiences to send emails to, and uncover what works.
Each email is scoped, the audience identified, professionally written, designed and then integrated with tracking from within the email as well as through analytics.


Driving traffic with no clear understanding of revenues or profitability


Intent led, tracked and accounted for profitable marketing spend
An unsteady flow of low-quality enquiries yielding little business
Motivated enquiries, in the buying cycle, who fit your ideal target market
Business critical tasks relying on staff time, subject to user error
Make processes more efficient, thorough, predictable and measurable
I spend most of my development budget fixing errors and bugs
Fast and reliable cash-generative e-commerce and lead generation websites
My organic traffic is not translating to the bottom line
Rankings with purpose, targeting your converting keywords
Dated branding which doesn’t match the quality of your business
Modern, digital, flexible brand, guidelines, messaging and identity
Low resolution homebrew quality with little impact
Short, sharp videos designed specifically for the right media channel
Marketing visuals that fail to engage your audiences
Smart, precise imagery demonstrating design with purpose
Lack of regular contact with previous customers and clients
A clearly segmented customer base with fine-tuned strategies for repeat business
I have analytics, but it doesn’t help with our decision-making
A connected analytics layer providing confidence in tactical and strategic marketing work
Vaguely written aggregated words with little meaning
Refined, considered and targeted persuasive copy with calls to action
Finding it a challenge to come up with quality ideas and engagement
Well-considered, precise, relatable and polished content
Occasional ad-hoc generic email communications
Focused varied marketing content, adapted to suit customer profiles
A store where most of your budget fixing bugs and maintaining
A store where the stock, turnover, margins and yield dwarfs the marketing spend
Leads and customers are mainly in spreadsheets and inboxes
Win and retain more business by selecting the right CRM and systems
Outdated systems with inaccessible or incomplete information
Joined up, cloud-based systems which optimise operations
There is only so much you can tell from our website. Find your marketing solution through a short call with the team.
Book A Call


